Most midstream operators already have the data to catch compressor failures weeks before they happen. It's sitting in PI System. The problem isn't the data — it's what you're doing with it.
What PI System Actually Gives You on a Compressor Station
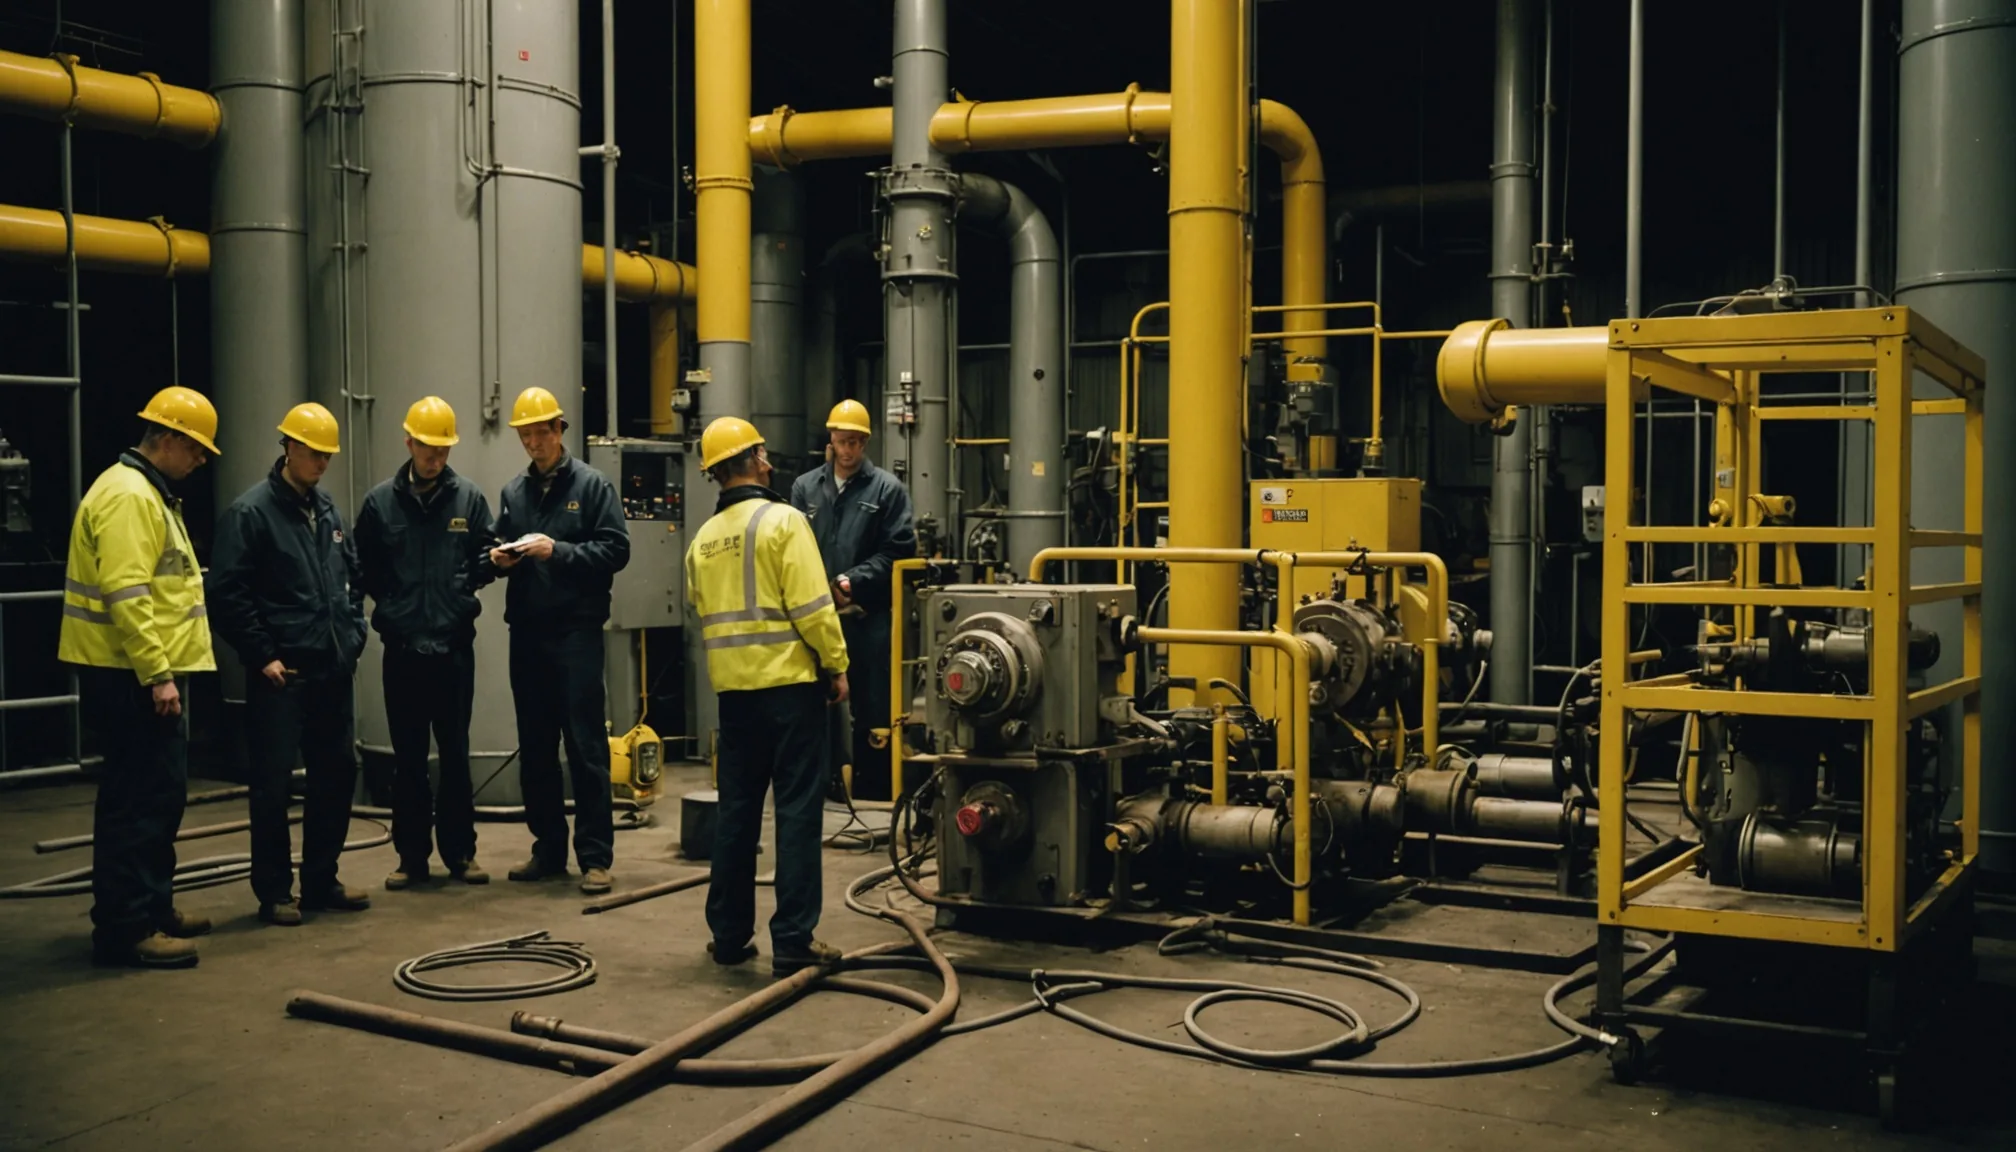
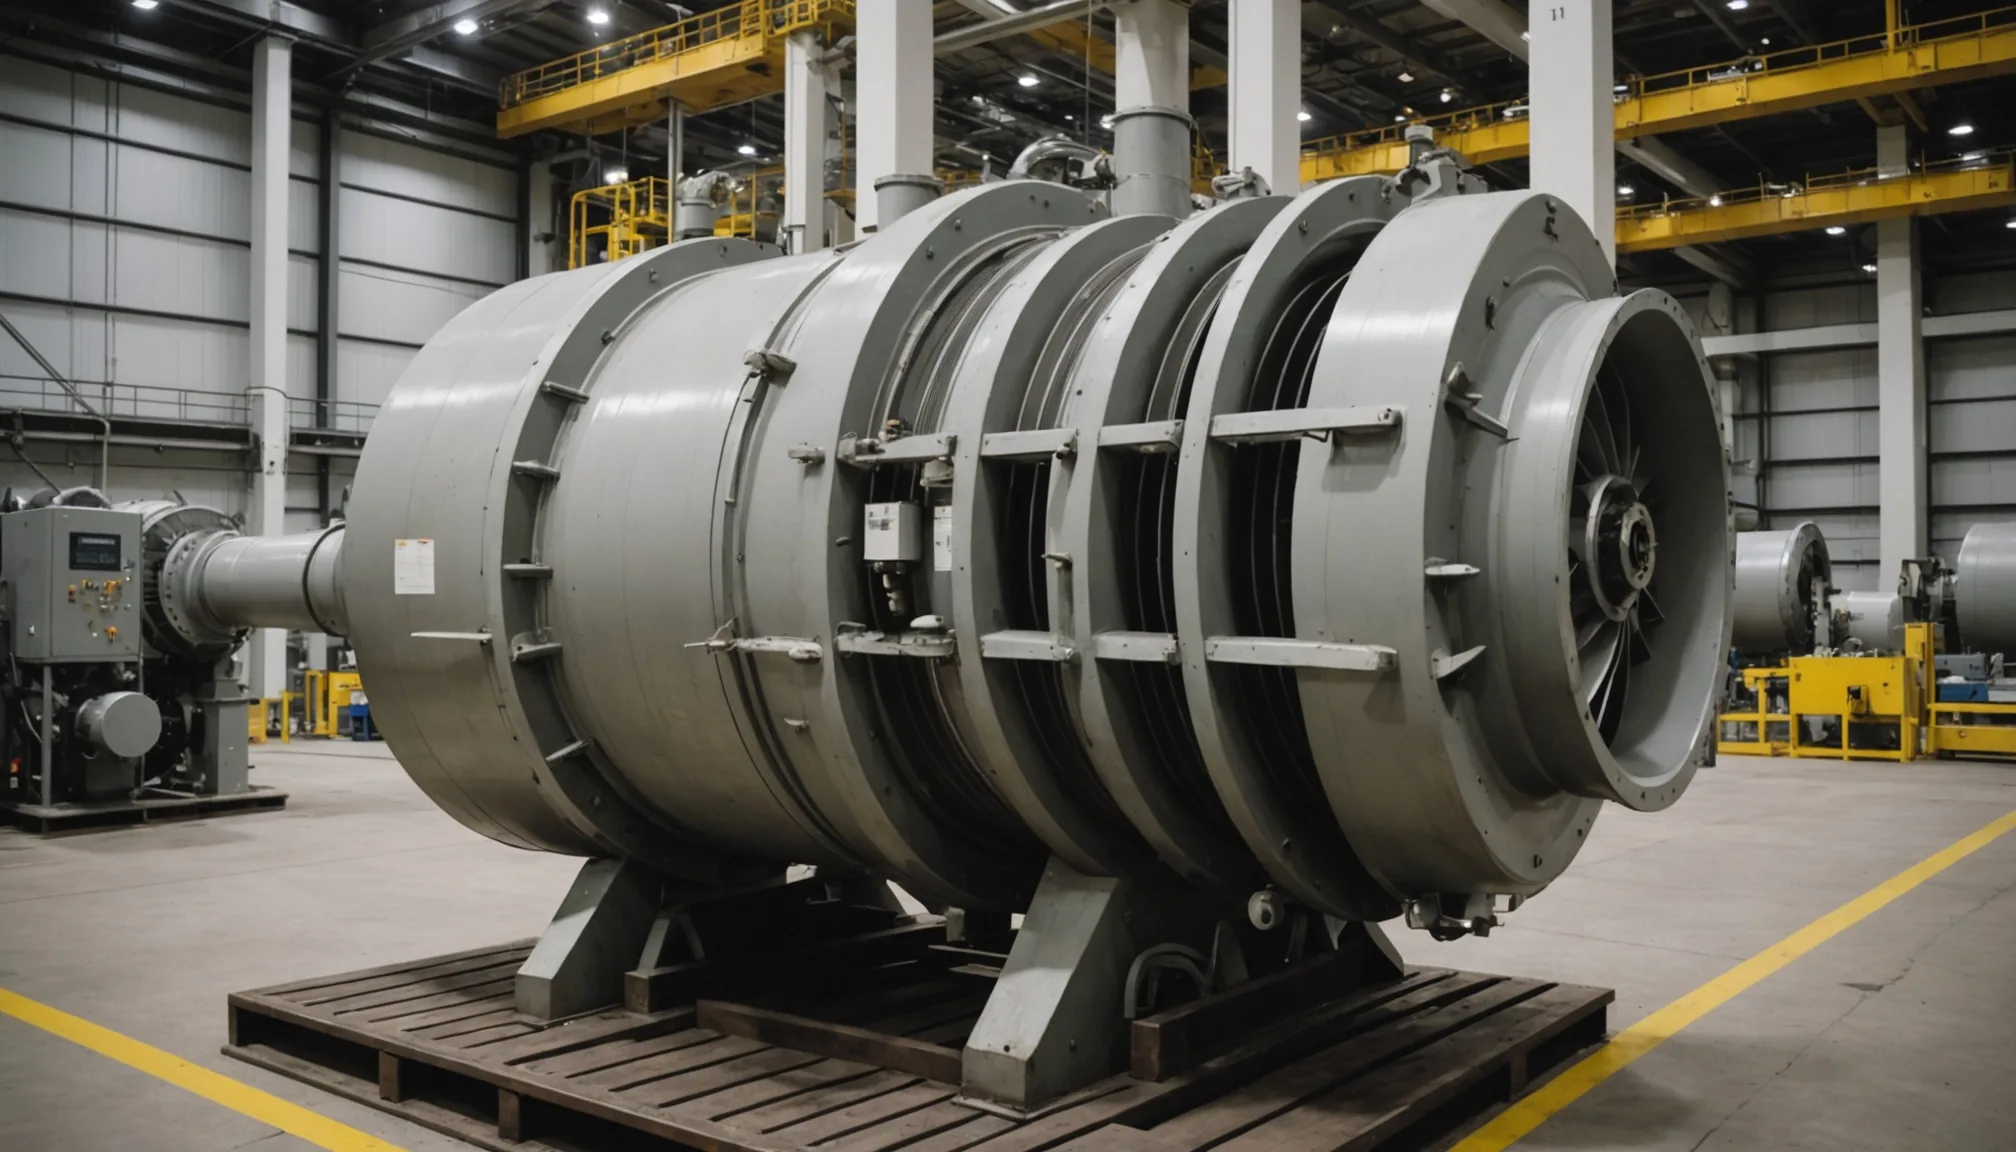
A typical Permian Basin compressor station feeding PI historian has a lot to work with. Proximity probes measuring shaft vibration amplitude at both drive-end and non-drive-end bearings. Thermocouple readings across bearing housings. Suction and discharge pressure transmitters. Lube oil differential pressure across the filter. Stage temperatures. Motor current draw. Seal gas supply and reference pressures on dry gas seals.
That's not a sparse dataset. On a well-instrumented reciprocating or centrifugal unit, you're looking at 40 to 80 tags per compressor — many running at scan rates of one second or faster inside the PI Data Archive. The PI Asset Framework layer sits on top, mapping those raw tags into equipment templates: one AF element per compressor, child elements per stage, attributes pointing back to the underlying PI points.
So the data is there. The tags are populated. The historian is running. What's missing?
Why PI Was Built for Forensics, Not Detection
Here's the thing: PI System was designed as a process historian, not a surveillance engine. It answers the question "what happened?" brilliantly. You pull up PI ProcessBook or PI Vision after a trip event and you can reconstruct exactly when bearing temperature started climbing, how discharge pressure trended in the two hours before shutdown, whether lube oil differential spiked before the ESD fired.
Excellent post-incident forensics. That's what the architecture was built for.
What it wasn't built for is catching the slow, statistically significant deviation that shows up 14 days before the trip. That requires three things PI doesn't natively provide: a normalization layer that accounts for varying operating conditions (you can't compare bearing temperature at 60% load to bearing temperature at 95% load without removing process influence first), a rolling baseline model that knows what "normal" looks like for this specific unit at this specific operating point, and an alerting system sensitive enough to flag a 1.2 standard deviation drift without drowning operators in noise every time ambient temperature swings.
PI Notifications can fire on threshold crossings. PI AF analyses can compute derived values. But stringing those capabilities into a genuine anomaly detection feed requires significant configuration work — and most operations teams don't have the data science bandwidth to build and maintain it across a fleet of 30 or 60 compressors.
The Fault Modes That Live in Your PI Data
In our experience working through PI historian archives, the majority of detectable failure precursors fall into three mechanical categories. Each leaves a distinct signature in the historian data.
Bearing Spall
Rolling element bearing spall typically announces itself through elevated broadband vibration amplitude measured at the proximity probe, combined with rising bearing housing temperature. On a centrifugal compressor, you'll often see the non-drive-end bearing temperature trending upward at 0.3 to 0.5°C per day across a two-week window before the unit trips on high temperature. In a PI archive, that slope is visible. It just doesn't generate an alert at that rate because no threshold is set that low.
Impeller Imbalance
Aerodynamic fouling and buildup on impeller blades creates imbalance that drives up 1X vibration amplitude at running speed. In PI, this shows as a slow increase in overall vibration level measured by the proximity probe, sometimes accompanied by small shifts in axial position on thrust bearings. The progression is gradual — weeks, not days — which makes it invisible to alarm-based monitoring but completely detectable with a baseline comparison model.
Dry Gas Seal Degradation
Seal leak shows up as a divergence between seal gas supply pressure and reference pressure. A healthy seal maintains a stable differential. A degrading seal shows increasing supply pressure demand as the operator compensation loop tries to maintain the buffer. Lube oil differential across the filter is a secondary indicator if the seal leak path allows liquid ingestion. Both tags are standard in most PI configurations — but no one is trending the ratio over time.
Fact: in our analysis of historical trip events, 60 to 70% of these failures were detectable using vibration and process historian data that was already being collected. The data existed. The model didn't.
Turning a Historian Into a Live Detection Feed
Converting PI historian data into an anomaly detection feed is not a configuration exercise. It's a modeling exercise that uses the historian as input.
The first requirement is a baseline. Midstreamly's degradation scoring engine builds individual equipment baselines using 18 months of operating history per asset. Eighteen months captures enough seasonal variation, load cycling, and operating mode transitions to build a representative normal operating envelope. A six-month baseline misses seasonal ambient effects. A three-month baseline is almost certainly built on data that includes the current degradation trend — which defeats the purpose.
The baseline model connects to PI System through the OPC-UA interface or directly through the PI Web API, depending on site network architecture. Data flows are configured per tag, with PI AF providing the equipment context that tells the model which tags belong to which compressor. The model ingests historian backfill to establish baseline, then switches to near-real-time polling to update its degradation scores.
Scores update every 15 minutes. Not real-time second-by-second — there's no value in that for slow-developing mechanical failures. A 15-minute cadence gives operators a current picture without generating alert fatigue from transient process events.
The output is a degradation score per asset, per fault mode. Not a raw vibration value. Not a temperature alarm. A dimensionless score from 0 to 100 that tells an operator: this bearing is at 73 out of 100 on the spall trajectory, and at the current rate of change, you have an estimated 12-day runway before this unit is at high risk of unplanned shutdown.
Why Beatriz Built This for Permian Basin Operators
The founding insight behind Midstreamly came out of 11 weeks embedded at a Permian Basin operator. Beatriz Herrera spent those weeks sitting with the control room team, watching three compressor shutdowns happen in six weeks. After each one, the post-incident review pulled up PI historian and found the same thing: the precursor data was there. Bearing temperature trending up. Vibration amplitude creeping. The signatures were clear in hindsight.
Nobody reviewed that data in advance. Not because they were negligent — the team was stretched, monitoring 40 units across three stations, and PI doesn't alert you to a 0.4°C per day trend. It only alerts you when you're already in the red.
Three shutdowns in six weeks. All detectable. None detected.
That's the operational reality this platform was built to change. Not by replacing PI System — operators have significant investment in their PI infrastructure and their AF configurations are not getting rebuilt — but by layering detection capability on top of the historian data that's already there.
What "60-70% Detectable" Actually Means in Practice
The 60 to 70% figure needs context. It means that 60 to 70% of compressor failures, looking at historical trip event data across midstream fleets, show detectable precursor signatures in vibration and process historian data 7 to 21 days before the failure event. Not all failures. Catastrophic mechanical failures — impeller fracture from foreign object ingestion, sudden seal failure from a process upset — leave no weeks-long precursor trail. Those are not preventable through condition monitoring.
But the failures that do leave a trail are disproportionately the ones that create the most operational disruption. Bearing degradation, imbalance progression, gradual seal wear — these are the failure modes that develop over days and weeks, and they're the ones that shut down a unit for three to five days of field repair plus logistics time for parts. Catching them 14 days out changes the maintenance equation entirely: you schedule the work, you stage the parts, you bring the unit down in a planned window instead of an unplanned trip at 2 AM.
The remaining 30 to 40% of failures — sudden and unpredictable — are not the target. We're honest about that. Condition monitoring is not a substitute for safety systems. It's a complement to them, focused specifically on the failure modes where early detection creates real scheduling value.
Connecting to PI Without Disrupting Existing Infrastructure
One concern we hear consistently: operators don't want to touch their PI infrastructure. Configuration is locked down, change management is formal, and the IT/OT boundary adds process overhead to any integration project.
The connection model is read-only. Midstreamly's platform queries PI historian data — it doesn't write to it, doesn't modify AF configurations, doesn't insert calculated tags into the archive. The integration uses PI Web API endpoints or OPC-UA server connections over the historian's existing network exposure. No changes to PI configuration. No PI AF modifications. No additional load on the PI Server that would affect existing PI client connections.
Setup time for a single compressor station, assuming PI Web API is already exposed to the plant network, is typically under two weeks from data access to first degradation scores. The longer timeline is historical backfill ingestion — pulling 18 months of hourly data for 30 to 60 tags per compressor to build the initial baselines.
The data is there. It's been there for years. That's what we keep coming back to when we work through PI archives with operators. The historian already contains the story of every bearing that degraded, every seal that wore, every impeller that fouled — written in process data that was collected but never read in time. That's the gap this platform was built to close.