An emergency compressor shutdown in a midstream operation is never just a maintenance event. It is a financial event. And in our experience tracking these incidents across gathering, transmission, and processing segments, the operators who underestimate the true cost are the ones who also underinvest in prevention.
The $18K-$95K Range Is Real. Here Is Why It Varies So Much.
Industry estimates peg the cost of a single unplanned compressor shutdown at $18,000 to $95,000. That is a wide spread. The variance is not noise. It reflects four distinct cost categories, each with its own multiplier depending on your operating context.
1. Lost Throughput Fees
Midstream operators run on throughput agreements. When a compressor trips unexpectedly, gas simply stops moving. Depending on contract structure, that means either forfeited revenue on volumes not delivered or penalty fees for failing to meet minimum delivery obligations. On a high-volume gathering lateral feeding a processing plant, throughput losses alone can clear $40,000 in 48 hours. Smaller laterals with thinner margins still see $8,000-$15,000 in lost throughput in a single day. Fast.
2. Expedited Parts and Logistics
Planned maintenance runs on a parts procurement cycle measured in weeks. Emergency shutdowns do not. Expedited freight, vendor premium pricing, and overnight staging for critical wear components routinely add 2 to 4 times the standard parts cost. A seal kit that costs $1,200 on a scheduled order becomes $3,500 on an emergency pull. Multiply that across multiple components on a reciprocating compressor and you understand why parts cost alone often exceeds the initial repair estimate.
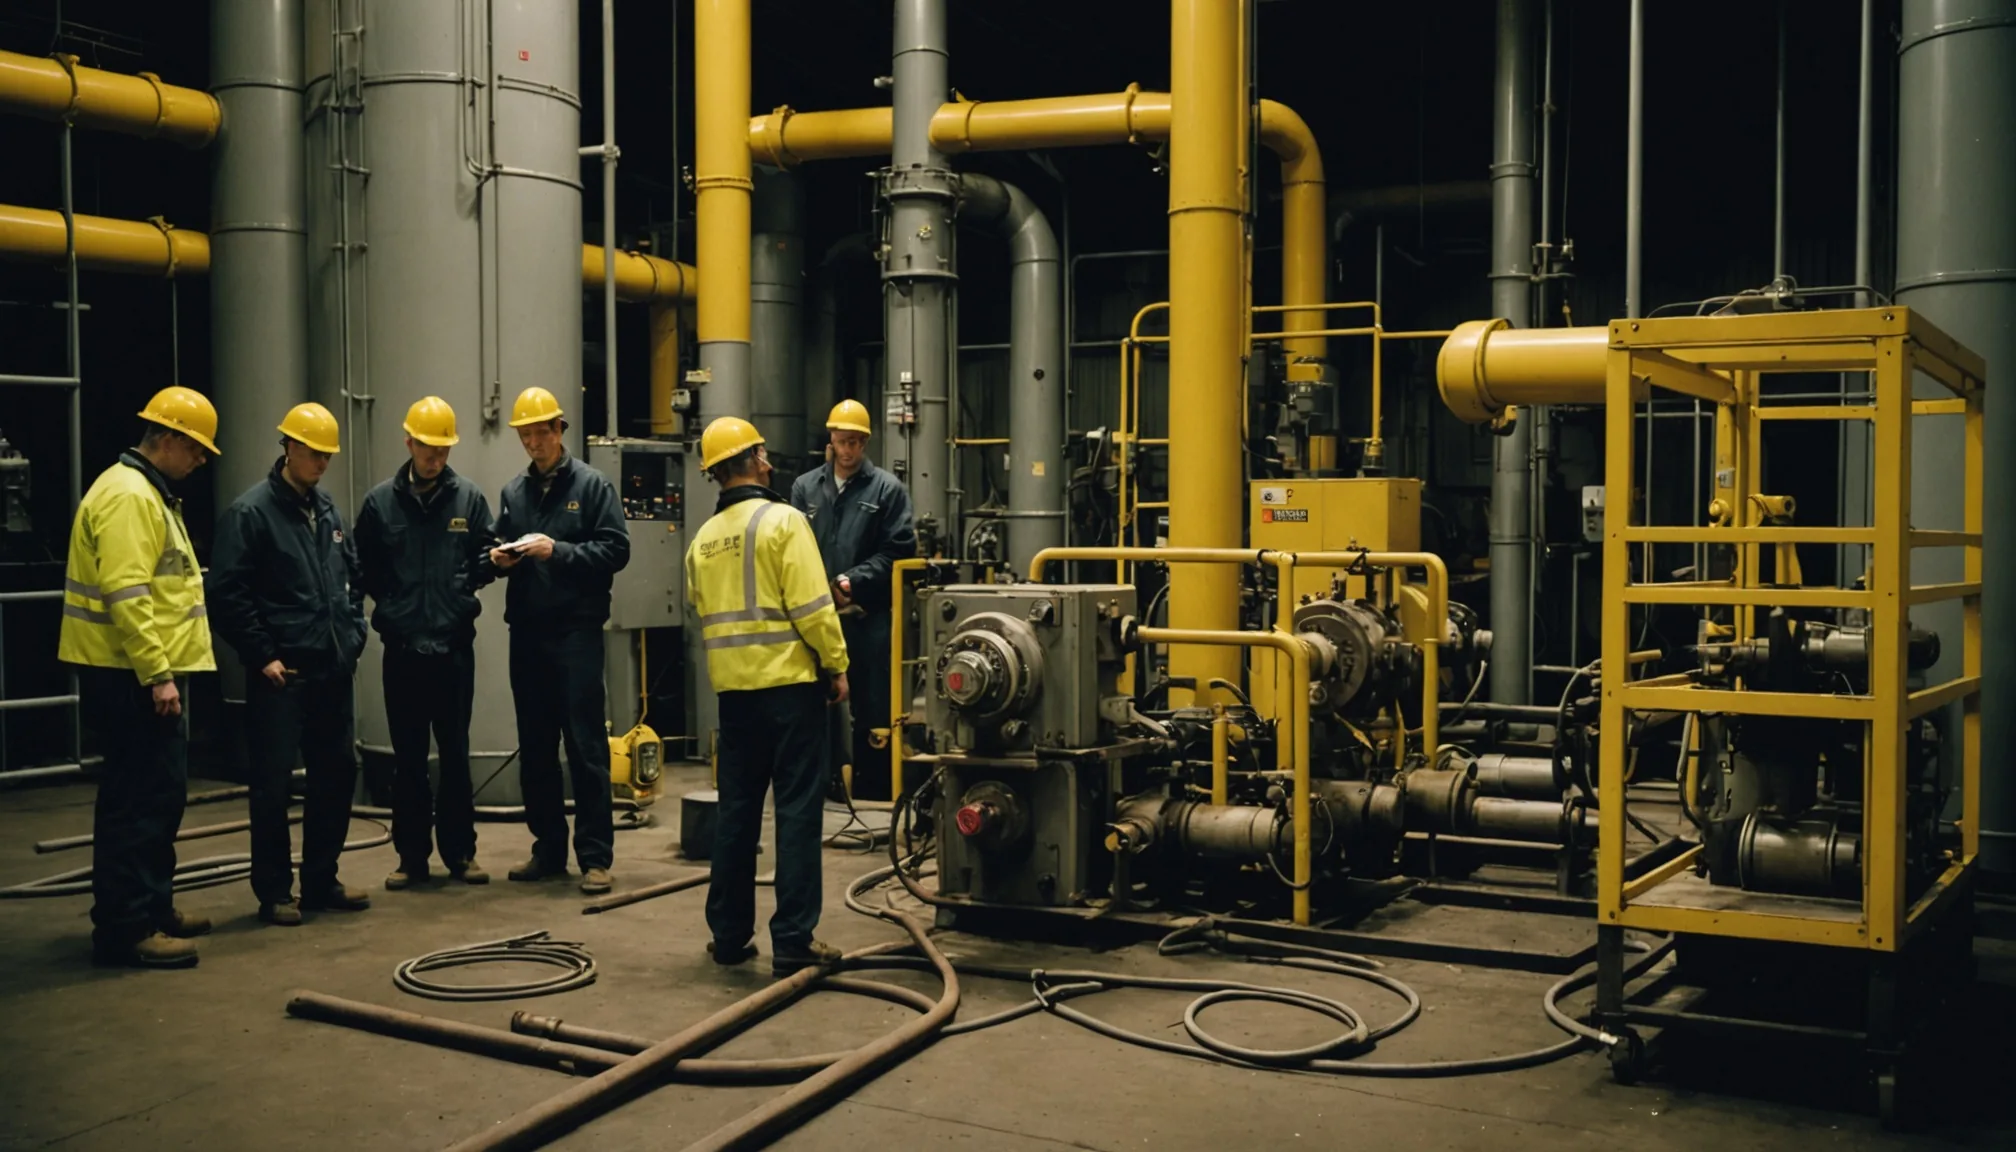
3. Emergency Contractor Mobilization
Field labor is the steepest variable. Emergency mobilization rates for qualified compressor technicians in major midstream corridors run 30-60% above standard day rates, with minimum call-out fees of $2,000-$4,000 regardless of job duration. If the failure occurs on a weekend or during a weather event, add another 25%. Add travel, lodging, and per diem for crews coming from outside the immediate region and a single emergency mobilization easily reaches $12,000 in labor costs before a wrench is turned.
4. Secondary and Cascade Effects
This is the cost category that rarely appears in post-incident reports. Compressors do not operate in isolation. A station compressor failure that backs up pressure on an inlet gathering system can force curtailments at multiple wellheads upstream. Those curtailments trigger their own contractual obligations. On interconnected systems, a single unplanned event at one station can generate financial exposure at three or four touch points simultaneously. The operators we have spoken with who have experienced this describe it as a cascade. The term is accurate.
How 4-9% Annual Unplanned Downtime Compounds Across a Fleet
Individual event cost is one problem. Fleet-level exposure is the harder one to quantify. And it compounds in ways that do not appear in single-incident analyses.
Industry data puts annual unplanned downtime for midstream rotating equipment at 4 to 9 percent of total operating hours. For a fleet of 50 compressors, each running roughly 8,400 hours per year, that translates to between 1,680 and 3,780 machine-hours of unplanned downtime annually. If you assign even a conservative $400 per machine-hour in blended throughput and labor cost, the annual fleet exposure runs between $670,000 and $1.5 million. That is a recurring cost. Every year. Often absorbed silently as a line item labeled "maintenance and repairs" that never gets the scrutiny it deserves.
Larger fleets in the 200-400 asset range see non-linear scaling. More assets mean more simultaneous failure risk, more logistical complexity in parts sourcing, and more demand on a fixed pool of experienced technicians. The downtime percentage stays roughly the same, but the absolute cost grows faster than asset count alone would suggest.
Planned vs. Emergency: The Cost Profile Is Not Even Close
Here is the comparison that makes predictive maintenance ROI calculations straightforward. A planned maintenance event on a reciprocating compressor, scheduled during a low-demand window with parts pre-staged and a regular crew assigned, typically costs $8,000-$18,000 in total. Scheduled outages run shorter. Crew efficiency is higher. Parts are priced at standard rates. No throughput penalties because the curtailment window is coordinated with upstream and downstream counterparties in advance.
The same repair executed as an emergency event costs $45,000-$95,000. Same wrench turns. Completely different cost profile. The repair itself is not more expensive. Everything surrounding the repair is.
That gap, the $65,000 difference between an emergency event and a planned outage on the same failure mode, is the ROI numerator for predictive maintenance. It is also the avoided cost that validated the first Midstreamly prototype deployment. The first event we caught early, before the compressor tripped, converted what would have been an $65,000 emergency into a $12,000 planned outage. A single event. That was the proof point that built the business case for the platform.
Why 60-70% of Failures Are Detectable 7-21 Days Out
This is the piece of the puzzle that makes early detection economically meaningful, not just technically interesting.
Research on rotating equipment failure modes, including vibration analysis, thermographic data, and lube oil degradation patterns, consistently finds that 60 to 70 percent of failures that lead to unplanned shutdowns produce detectable precursor signals 7 to 21 days before the actual trip event. The signals are subtle in early stage: a shift in sub-synchronous vibration frequency, a bearing temperature that runs 3-4 degrees Celsius above historical baseline, a small but statistically significant change in discharge pressure variance.
None of these signals trigger alarm thresholds. That is the point. They are not alarm conditions. They are trend conditions. And without continuous monitoring infrastructure to track trends across multiple variables simultaneously, they are invisible.
Seven to twenty-one days of lead time changes the maintenance cost profile entirely. With 14 days of advance notice, a maintenance coordinator can order parts at standard pricing, schedule a qualified crew at regular rates, coordinate the curtailment window with shippers and counterparties, and execute the outage in a planned window. Same failure. Completely different financial outcome.
The ROI Calculation: How to Model Predictive Maintenance Value
The math is not complicated. The friction is usually organizational, not analytical.
Start with your annual fleet downtime. If you have 100 compressors and run at 5% unplanned downtime, you have approximately 4,200 machine-hours of unplanned downtime annually. Assign a blended cost per event. If your average emergency shutdown costs $45,000 and you have roughly 15-20 events per year across the fleet, your annual emergency maintenance cost runs $675,000 to $900,000.
Now apply the 60-70% detectability rate. If early detection converts 65% of those events from emergency to planned, at an average savings of $30,000 per event, the gross avoided cost is $290,000 to $390,000 annually. Subtract the cost of the monitoring infrastructure, typically $80,000-$180,000 per year for a 100-asset fleet at current sensor and software pricing, and net annual ROI lands in the $110,000-$210,000 range. Payback period: 6 to 14 months. In our modeling across various fleet sizes, ROI positive in year one is the norm, not the exception.
These are not theoretical numbers. The variability in the range reflects real differences in fleet age, operating environment, asset mix, and existing maintenance program maturity. Operators with older equipment running in harsher environments tend to land toward the higher end of both the emergency cost and the detectability benefit ranges.
What Gets Missed in Most Cost Analyses
One thing we see repeatedly: post-incident cost reports undercount the true event cost because they capture direct labor and parts but miss throughput penalties, contractual exposure, and the secondary effects on connected assets. The reported cost is $22,000. The actual economic impact is $58,000. The difference lives in three line items that engineering never sees.
For operators building the business case for predictive maintenance investment, that gap matters. Model the full cost of an event, not just what lands in the maintenance work order. Include throughput impact at your average daily volume rate. Include contractor premium above standard labor. Include contractual exposure if you operate under firm transportation agreements. The ROI case gets stronger, not weaker, when the full cost picture is on the table.
Where to Start
If you are running a fleet of 50 or more compressors and relying primarily on scheduled interval maintenance and manual inspections, the first step is not a full monitoring deployment. It is a baseline audit. Understand your current unplanned downtime percentage. Calculate your blended emergency event cost using the framework above. Model the avoided cost at 60% detection rate. That exercise usually makes the investment decision obvious.
The operators who have been through that process tell us the same thing. The numbers were always there. They just had not been assembled in one place before.